

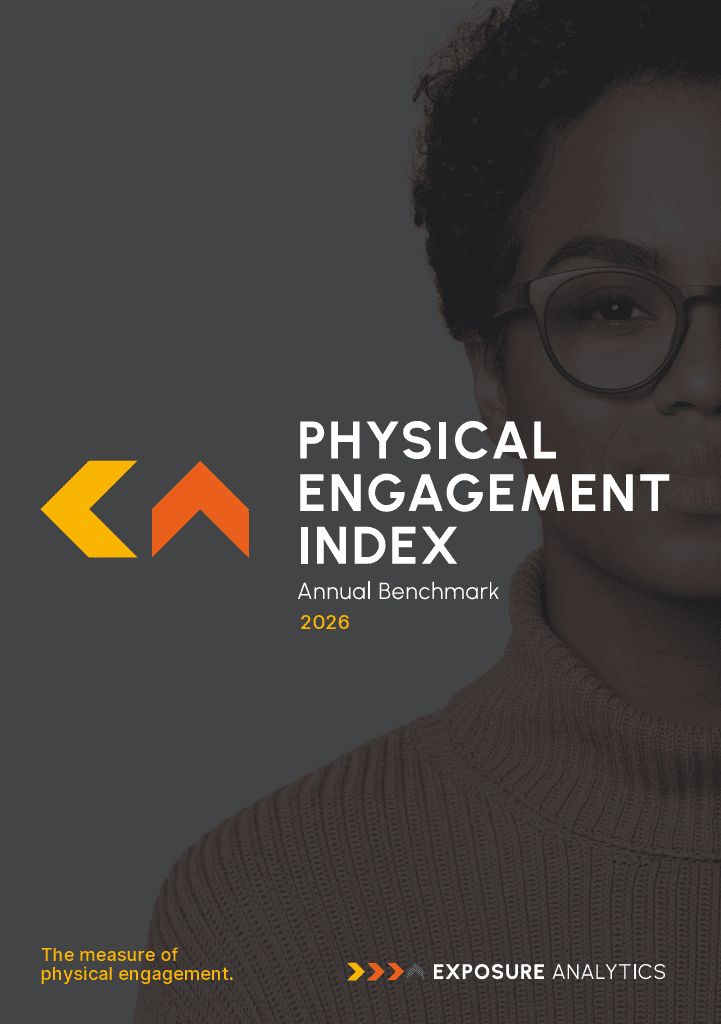
The Physical Engagement Index 2026.
Footfall tells you the room was full. It doesn’t tell you what happened in the room.
Get the report
Produced by

- 43.8M visitors measured since 2020
- 18 countries and sectors benchmarked
- 13:50 avg. dwell time for engaged visitors vs. seconds for digital
- 20x engagement gap: top vs. bottom 10% of spaces

The problem
Footfall counts heads. It doesn't count attention, dwell time or behaviour.
In an era where every other marketing channel is measured on what it actually produces, physical spaces are still reporting on who showed up — not what they did when they got there.

What's inside
Discover what separates high-performing physical spaces from the rest
The 20x engagement gap
between the best and worst physical spaces.
Booth position data
why front-left outperforms front-and-centre on conversion and dwell.
Seasonal benchmarks
October vs. December shifts engagement by 12 percentage points
Sector and regional breakdowns
across 18 countries

The report
Get the Physical Engagement Index.
Fill in the form to receive your copy today.
Built on real-world measurement
Exposure Analytics has measured:
- 11k+ Events, across
- 92.8M visitors
- since 2014
Ready to measure your own events?
The Physical Engagement Index benchmarks what's possible. Exposure Analytics shows you where your spaces sit against it; in real time, at every event you run.
Contact Us